If you’re working in Compliance, you surely followed the news on Germany’s latest major case of financial statement fraud of a DAX company (that is a company listed in the German stock exchange) called Wirecard. Assumed to be the poster child of a new technology company they seemed to be able to compete with the technology giants and startups in the area of online payments.
And the story reads like the script for a new streaming blockbuster show worthy of an Oscar:
Here is a shortlist of latest highlights:
- Financial statement fraud on a major scale apparently since at least 2015
- Fictitious revenue in the billions
- Multiple unheard warnings for years and years
- CEO put into jail, out on bail, back into jail
- Another board member absconded, last seen skipping in Manila, Philippines, alleged to work for the Russian intelligence service…
- Successfully applied for a banking license and thus owns a bank
- Partner processing companies with addresses in residential areas or bus/tour companies parking lots
Wirecard made its way from the end of the nineties as a call center service provider (then called InfoGenie) with negative equity in 2002 to facilitating online payments with allegedly stellar results for the last 20 years.
One could reasonably wonder how a company that lost its major markets of facilitating online payments for online gambling casinos and websites with adult content due to changes in US law could ever compete with giants like PayPal, Apple Pay, AliPay etc and reach such considerable heights of revenue…?
But,
setting this aside, I was wondering what we could discern from looking at official figure announcements and publications like yearly and/or quarterly financial statements from Wirecard.
So, I downloaded all publications and financial announcements from Wirecard’s website here under this link on August 26, 2020:
https://ir.wirecard.de/websites/wirecard/German/5000/news-_-publikationen.html
Here is the path, that I followed: www.wirecard.de -> Unternehmen -> Investor Relations -> News and Publications. As of here you can either chose “ “Finanzberichte” or “Präsentationen” and pick a year and download publications and/or presentations in German and English.
The download comprised financial statements and presentations starting in 2002 and going all the way up to 2019. The yearly information for 2019 of course is at the time of this blog’s publication still under dispute…
Let us look at some selected figures from the 2018 annual report pages 118 – 120 as per the screen shots down below. A striking figure is “Cash and Cash equivalents” (Zahlungsmittel und Zahlungsmitteläquivalente) marked in a blue rectangle rising from 1.3 billion € at the beginning of 2017 via 1.9 billion € at the end of 2017 to 2.7 billion € at the end of 2018. Not only is this a stellar rise, but for 2018 this constitutes roughly 50% of the balance sum. Who has so much cash and why? If we scroll down the balance sheet we find strikingly similar figures under short-term debt (1.3; 1.9 and 2.9) marked in a blue rectangle further down, which would result in a cash ratio = short-term debt/cash = ~1. A cash ratio of 1 usually indicates that a company can pay off all of its short-term debt with its cash. This is a ratio investors and analysts like to see. But the striking similarity of the figures of cash to short-term debt in 3 consecutive years calls for further investigation as this looks more like making the cash and cash equivalents figures match the short-term debt.
Let us look at the debt to equity ratio defined as total liabilities/total equity. This quotient worsens from 1.3 at the beginning of 2017 via 1.7 at the end of 2017 to 2 at the end of 2018. This indicates that debt is highly and quickly increasing, although the cash ratio seems so favorable. This should be investigated.
Finally, let us do a Benford’s law test for the balance sheet and the income statement for 2018 pages 118 – 120 from Wirecard’s annual report 2018. https://ir.wirecard.de/download/companies/wirecard/Annual%20Reports/DE0007472060-JA-2018-EQ-D-02.pdf
I extracted the following 39 figures marked in red rectangles from this report. Please click on the pictures to enlarge them.

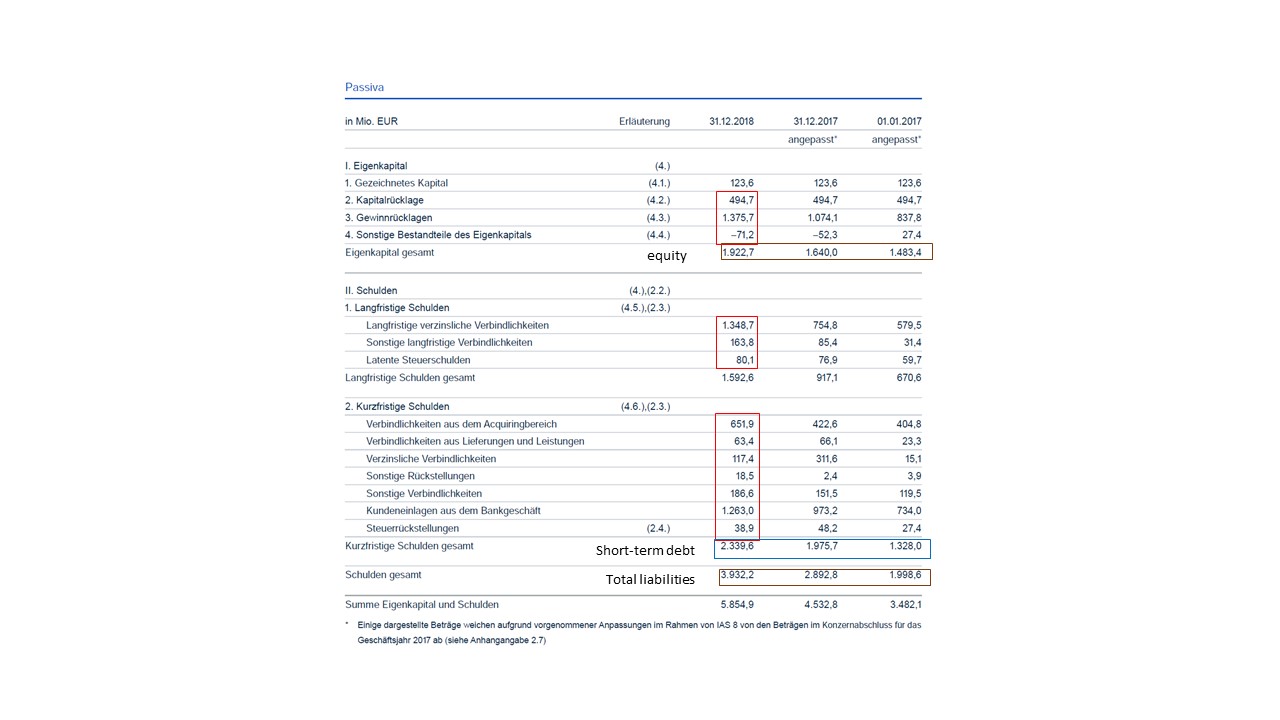
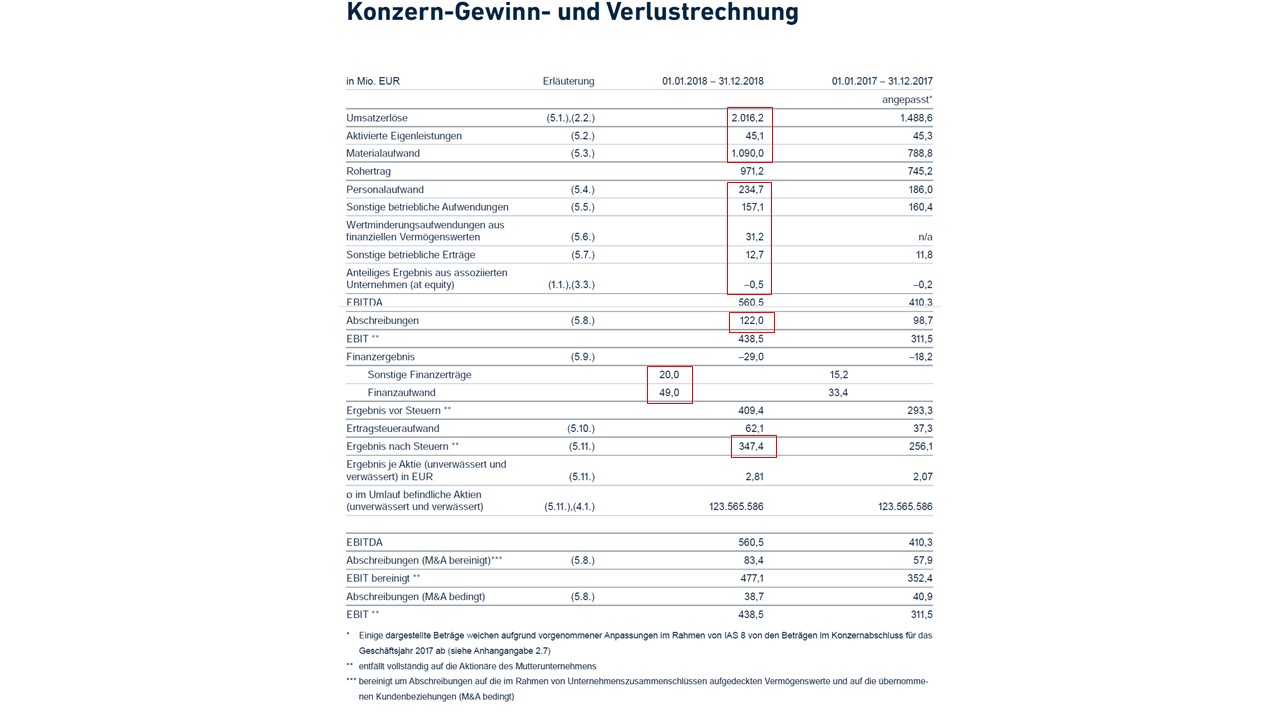
I picked only those numbers that are not resulting figures from a calculation on the balance or on the income sheet. The -0,5 was noted down as a 50 in my calculation to avoid reporting a leading 0.
And here is the result for Benford’s Law on First Digits:
| Benford’s Law | Probability | Data Set | Digit | Count | Probability | |
| First Digit | 1 | 30,1 | First Digit | 1 | 18 | 46,15 |
| 2 | 17,6 | 2 | 4 | 10,26 | ||
| 3 | 12,5 | 3 | 4 | 10,26 | ||
| 4 | 9,7 | 4 | 5 | 12,82 | ||
| 5 | 7,9 | 5 | 1 | 2,56 | ||
| 6 | 6,7 | 6 | 3 | 7,69 | ||
| 7 | 5,8 | 7 | 2 | 5,13 | ||
| 8 | 5,1 | 8 | 2 | 5,13 | ||
| 9 | 4,6 | 9 | 0 | 0,00 | ||
With the exception of 8 as the leading digit in a number, all expected probabilities are off. One could reasonably argue that 6 and 7 are close. One could even argue that 3 and 4 are close to the expected probabilities. But 1 is off by far and so are 2, 5 and 9.
Let us look at Second Digits now.
| Benford’s Law | Probability | Data Set | Digit | Count | Probability | |
| Sec Digit | 0 | 12,0 | Sec Digit | 0 | 8 | 20,51 |
| 1 | 11,4 | 1 | 6 | 15,38 | ||
| 2 | 10,9 | 2 | 3 | 7,69 | ||
| 3 | 10,4 | 3 | 7 | 17,95 | ||
| 4 | 10,0 | 4 | 2 | 5,13 | ||
| 5 | 9,7 | 5 | 5 | 12,82 | ||
| 6 | 9,3 | 6 | 1 | 2,56 | ||
| 7 | 9,0 | 7 | 1 | 2,56 | ||
| 8 | 8,8 | 8 | 4 | 10,26 | ||
| 9 | 8,5 | 9 | 2 | 5,13 | ||
At first glance all probabilities are off. One could argue that 5 and 8 are close and maybe 9.
This is an interesting result, albeit one has to take it with considerable care. Benford’s Law does work well with large samples >=1,000 numbers. The sample only has 39. I might have added typos. But still this is something that a fraud investigator would have to analyze.
And this is just the result from looking at a few figures and ratios from the latest available annual report…
